Introduction
Financial projections are essential for any business or organization. They provide an estimate of future income and expenses, helping you plan ahead and make informed decisions. Making financial projections in Excel is an effective way to create accurate projections and track them over time. In this article, we’ll explore the benefits of making financial projections in Excel and provide a step-by-step guide on how to do it.
What are Financial Projections?
Financial projections are estimates of future financial performance, based on past performance and current trends. They help businesses and organizations set realistic goals, plan for growth, and make sound financial decisions. Typically, financial projections cover a period of one to five years, but can be longer or shorter depending on the situation. They include estimates of revenue, expenses, cash flow, capital investments, and other financial variables.
Benefits of Making Financial Projections in Excel
Excel is a powerful tool for making financial projections. It allows you to easily enter, organize, and analyze data. You can also use formulas and functions to automate calculations, as well as create graphs and charts to visualize the results. Excel also makes it easy to update your projections as new information becomes available.
Step-by-Step Guide on How to Make Financial Projections in Excel
Making financial projections in Excel involves several steps. Here’s a step-by-step guide on how to do it.
Setting Up the Spreadsheet
The first step is to create a spreadsheet in Excel. Set up columns for each type of financial data you want to track, such as revenue, expenses, and cash flow. If you’re projecting multiple years, add one column for each year. If you’re projecting quarterly or monthly, add one column for each period.
Entering Financial Data
Next, enter your financial data into the spreadsheet. This includes historical data, such as actual revenue and expenses from previous years, as well as projected data, such as estimated revenue and expenses for the future. Be sure to double-check your entries to ensure accuracy.
Formatting the Spreadsheet
Once you’ve entered your data, format the spreadsheet so it’s easier to read and understand. Add headers to the columns, color-code rows and columns, and adjust the font size and style. You can also use built-in features such as conditional formatting to highlight important data points.
Calculating Projected Values
Now that you have your data entered and formatted, you can begin calculating the projected values. Use formulas and functions to add, subtract, multiply, and divide numbers in order to calculate the projected values. Excel has a wide range of built-in formulas and functions that you can use to make your calculations.
Exploring the Power of Excel for Financial Projections
Excel provides a variety of tools and features that you can use to make financial projections. Here are some of the ways you can use Excel to make more accurate projections.
Understanding Formulas
Formulas are fundamental to making accurate financial projections in Excel. They allow you to quickly and accurately calculate the projected values based on your input data. Spend some time familiarizing yourself with the different types of formulas available in Excel, and practice using them to make projections.
Using Functions and Macros
Functions and macros are pre-written formulas that you can use to automate calculations. Excel has hundreds of built-in functions that you can use to make projections. You can also create custom macros to perform complex calculations with minimal effort.
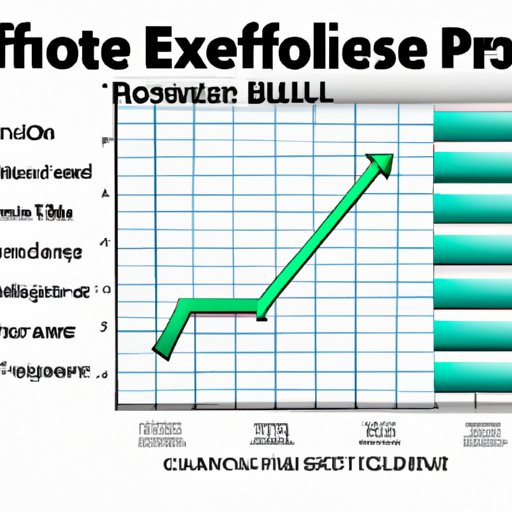
Analyzing Data with Graphs and Charts
Graphs and charts are useful for visualizing your data and analyzing trends over time. Excel has a variety of built-in chart types that you can use to display your data in an easy-to-understand format. You can also customize the charts to make them more visually appealing.

Crafting Accurate Financial Projections with Excel
In addition to understanding formulas and using functions and macros, there are other steps you can take to make more accurate projections. Here are some tips for crafting accurate financial projections in Excel.
Estimating Revenue and Expenses
Revenue and expenses are key components of financial projections. Estimate your revenue and expenses by researching industry trends, analyzing competitor data, and considering potential changes in the market. Make sure to factor in inflation when estimating future expenses.
Calculating Ratios and Breakeven Points
Ratios and breakeven points are useful metrics for evaluating financial performance. Calculate these metrics by dividing one number by another. For example, to calculate the breakeven point, divide total fixed costs by the difference between unit selling price and variable costs per unit.
Setting Goals and Benchmarks
Goals and benchmarks provide targets to strive for when making projections. Set realistic goals and benchmarks based on your research and analysis. Monitor progress towards these goals and adjust them as needed.
Excel Tips and Tricks to Make Financial Projections Easier
Making financial projections in Excel doesn’t have to be difficult. Here are some tips and tricks for making the process easier.
Automating Tasks
You can use macros and scripts to automate tedious tasks, such as entering data or calculating formulas. This can save you time and reduce errors, allowing you to focus on more important tasks.
Streamlining Data Entry
Data entry is an important part of making financial projections. To make the process easier, use templates and shortcuts to quickly enter data into the spreadsheet. You can also use data validation to ensure that only valid data is entered.
Adding Visual Elements
Visual elements, such as graphs and charts, make it easier to understand and interpret data. In Excel, you can add visual elements to your projections to make them more informative and engaging. Consider using icons, images, and other visual elements to make your projections stand out.
Conclusion
Making financial projections in Excel is a powerful way to plan for the future and make informed decisions. It allows you to easily enter, organize, and analyze data, as well as automate calculations and visualize results. With the right knowledge and tools, you can craft accurate financial projections in Excel.
In this article, we explored the benefits of making financial projections in Excel and provided a step-by-step guide on how to do it. We also discussed the power of Excel for financial projections, including understanding formulas, using functions and macros, analyzing data with graphs and charts, estimating revenue and expenses, calculating ratios and breakeven points, setting goals and benchmarks, and tips and tricks for making the process easier.
(Note: Is this article not meeting your expectations? Do you have knowledge or insights to share? Unlock new opportunities and expand your reach by joining our authors team. Click Registration to join us and share your expertise with our readers.)