Introduction
Managing your finances can be a daunting task, especially when you’re juggling multiple accounts and investments. But, with the right tools and strategies, you can easily keep track of your finances with Excel. In this article, we’ll take you through the steps for creating a budget template, utilizing conditional formatting, automating data entry with macros and formulas, using visualizations to see trends in spending, setting up automatic reminders for payments, and tracking investments with stock price monitoring tools.
Create a Budget Template in Excel
Creating a budget template in Excel is an excellent way to get organized and stay on top of your finances. To create a basic budget template, simply open a new spreadsheet in Excel and enter your expenses into separate columns. You can include categories like rent or mortgage payments, utilities, groceries, debt payments, and any other recurring expenses. Next, add a column for each month and enter your projected expenses for that month. Finally, add a total row at the bottom of the table to show your total projected expenses.
You can also personalize your budget template by adding features like dropdown menus, color coding, and checkboxes. Dropdown menus are great for categorizing expenses, while color coding can help you quickly identify outliers. Checkboxes are handy for tracking which bills have been paid. Once you’ve created your budget template, you can start entering your actual expenses to keep track of where your money is going.

Utilize Conditional Formatting to Highlight Outliers
Conditional formatting is a powerful tool in Excel that allows you to apply formatting to cells based on their content. For example, if you want to highlight any expenses that exceed a certain amount, you can use conditional formatting to display those values in a different color. To do this, select the range of cells containing your expenses and click on the “Conditional Formatting” button. Then, choose “Highlight Cells Rules” and select “Greater Than.” Enter the value you want to compare your expenses against and choose the formatting you want to apply.
You can also use conditional formatting to highlight cells that contain specific text. This is useful for quickly identifying expenses that fall into certain categories. For example, you can use conditional formatting to highlight all of your grocery expenses in one color and all of your entertainment expenses in another color. This makes it easy to track your spending in each category.

Automate Data Entry with Macros and Formulas
Macros and formulas can be used to automate data entry in Excel. Macros are small programs that allow you to record a series of actions and then repeat them with a single click. For example, if you often need to enter the same data into multiple cells, you can record a macro to perform this task for you. Formulas, on the other hand, are equations that calculate values based on the data in your spreadsheet. For example, you can use a formula to automatically calculate the sum of a range of cells.
Using macros and formulas to automate data entry can save you time and effort. It can also help prevent errors, since macros and formulas are less prone to mistakes than manual data entry. To get started, you can look for pre-existing macros and formulas online, or you can create your own using the Macro Recorder and Formula Builder in Excel.
Use Visualizations to See Trends in Spending
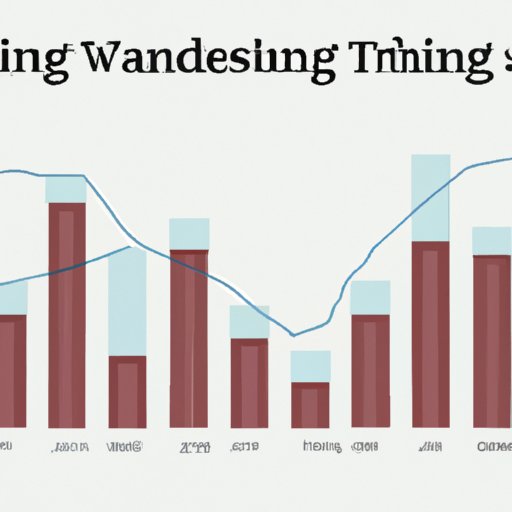
Visualizations are graphical representations of data that can be used to quickly spot trends and outliers. Excel has several built-in visualization tools, including line graphs, bar charts, and pie charts. These tools can be used to analyze spending over time or compare spending in different categories. For example, you can use a line graph to track your monthly expenses or a bar chart to compare your spending in various categories.
Using visualizations is a great way to gain insights into your spending habits. It can help you identify areas where you may be overspending or underutilizing your funds. Plus, visualizations are much easier to interpret than raw data, so they can be helpful for both experienced users and beginners.
Set Up Automatic Reminders for Payments
Setting up automatic reminders for payments is a great way to make sure bills are paid on time. Excel has a feature called “Reminders” that allows you to set up notifications for upcoming bills. When you enter a new bill, you can set a date for when you want to be reminded about the payment. When the reminder date arrives, Excel will send you a notification so you don’t forget to pay the bill.
Automatic reminders can help you avoid late fees and other penalties associated with missed payments. They can also help you stay organized and on top of your finances. Plus, setting up reminders is easy—all you have to do is enter the payment information and select a reminder date.
Track Investments with Stock Price Monitoring Tools
If you have investments, you can use stock price monitoring tools to track the performance of your portfolio. Excel has several built-in tools for tracking stocks, including the Stock Price Monitor and Stock Quote Lookup. The Stock Price Monitor shows a list of stocks and their current prices, while the Stock Quote Lookup allows you to search for specific stocks and view their historical performance.
Using stock price monitoring tools can help you stay on top of your investments. You can quickly identify winners and losers and make informed decisions about when to buy and sell. Plus, these tools can help you analyze the performance of your investments over time, so you can make more informed decisions in the future.
Conclusion
In conclusion, Excel is a great tool for managing your finances. With the right strategies, you can create a budget template, utilize conditional formatting, automate data entry with macros and formulas, use visualizations to see trends in spending, set up automatic reminders for payments, and track investments with stock price monitoring tools. By following these steps, you can stay organized and on top of your finances.
(Note: Is this article not meeting your expectations? Do you have knowledge or insights to share? Unlock new opportunities and expand your reach by joining our authors team. Click Registration to join us and share your expertise with our readers.)